
Abstract
The roof of an HCl fiber-reinforced plastic (FRP) chemical tank failed by accident after it had been operated for less than its expected lifetime. A possible cause is the change in day and night temperature, which lead to the cyclic change in the concentration of HCl vapor in contact with roof part. To investigate this possibility, a detailed analysis on the durability of the material exposed to cyclic solution concentration is required. In this research, vinyl ester-glass fiber composite specimens were exposed to 35 mass % and 0 mass% of HCl alternately at 40°C to replicate cyclic concentration exposure in both the vapor and liquid phases. The mass uptake and penetration depth of HCl as well as the strength loss of the material were investigated. Mass uptake and thickness change in vapor phase shows two times higher than liquid phase, at 3.5% and 6% respectively. This occurs due to differences in the concentration of solutions that diffuse to the specimen in the vapor phase and liquid phase. This phenomenon arises from variations in the concentration of solutions that diffuse to the specimen in both vapor and liquid phases. The diffusion process is facilitated by osmotic pressure, leading to material swelling and contributing to their degradation. The result of flexural strength measurement of specimens indicated a decreasing trend as exposure time increased. The flexural strength decreases by up to 36% due to plasticization. The Cl and water content profile in specimens that obtained from elemental mapping of cross-sections using Energy-Dispersive X-ray Spectroscopy (EDS) are enhancing the study on how materials degrade, which may be a reason for damage to FRP tank roofs.
Author Contributions
Academic Editor: Anubha Bajaj, Consultant Histopathologist, A.B. Diagnostics, Delhi, India
Checked for plagiarism: Yes
Review by: Single-blind
Copyright © 2025 Tania Natasha Dharmakusumah, et al
 This is an open-access article distributed under the terms of the Creative Commons Attribution License, which permits unrestricted use, distribution, and reproduction in any medium, provided the original author and source are credited.
Competing interests
The authors have declared that no competing interests exist.
Citation:
Introduction
Glass-fiber-reinforced plastics (GFRP) composites have gained a lot of interest as a material that can replace steel and aluminum in chemical plant applications for storage tanks, pipes, and decks 1. Due to its advantages, including corrosion resistance, high stiffness, and high strength, GFRP composites were adopted for chemical storage tanks that contained corrosive chemical solutions such hydrochloric acid (HCl) and sulfuric acid (H2SO4) 2. GFRP composites for chemical equipment are typically made up of unsaturated polyester (UP) or vinyl ester (VE) matrix with glass fibers for reinforcing fiber 3, 4. VE is more water resistant than unsaturated polyester because its chemical structure contains fewer ester bonds, but it is more expensive 5. Moreover, VE composites show a higher initial modulus and shear stress 6, 7.
VE composite degradation has been studied. Accelerated aging for up to 150 days and mechanical property testing in a controlled lab setting by changing temperatures and solution pH to determine glass fiber reinforced VE composite breakdown mechanism were reported 8, as well as an Arrhenius study that was performed to ascertain the rate of degradation acceleration observed at elevated temperature 9. In addition to Arrhenius equation, Fick's equation may effectively predict the moisture diffusion behavior in glass fiber reinforced VE composite pipes. Furthermore, the diffusion coefficient and the proportion of absorbed moisture indicated an increase as the immersion temperature increased 10. The performance of GFRP VE composites was also examined under water immersion and it was revealed that degradation was caused by plasticization, hydrolysis, matrix debonding, and matrix microcracking 11. The investigation of degradation mechanisms of GFRP VE under water and acid conditions for temperature changes has also been conducted extensively 12, 13, 14, 15, 16, 17, 18, 19. The effect of acidic solutions on flexural property of matrix resin on temperature changes also has been investigated 20, 21. However, no study has been conducted to observe the degradation behavior resulting from changes in solution concentration.
GFRP composites equipment is capable of very long-term use. However, there have been reports of severe accidents involving GFRP chemical tanks storing hydrochloric acid (HCl) which tend to fail at the roof part after less than 20 years of usage 22. GFRP chemical tank roof failure raises the question of why the material's vapor phase performance decreased more than the wall-side directly exposed to liquid solution. However, most investigations on water or chemical solutions found that material in contact with liquid phase decreased performance more than material in contact with vapor phase. The different phenomenon may be induced by dynamic influences like daylight and nighttime temperature cycles. The temperature cycle causes condensation and evaporation, which changes the concentration of chemicals in contact with the vapor phase and can induce roof tank collapse.
A study on polymeric material deterioration under cyclic solution concentration is needed to understand this phenomenon. This paper investigates the degradation of GFRP VE composites exposed to cyclic solution concentration using rapid immersion and gravimetric analysis. The effect of exposure on mechanical properties is also investigated. Findings aim to clarify the degradation processes and support the development of more reliable GFRP materials with improved durability and lifetime prediction in corrosive chemical environments.
Materials and Methods
Materials
Material that is used in this study is GFRP that consists of glass fiber and matrix resin. Glass fiber reinforcement used in this study is chopped-strand mat E-glass type. Vinyl ester resin made from epoxy novolac is used for chemical storage tanks, pipes, ducting, fume extraction systems, and gas cleaning units because it can resist chemicals well even at high temperatures. These exhibit tensile elongation and superior corrosion resistance, rendering them a potential material for manufacturing lining coatings with exceptional adherence to various polymers and traditional materials such as steel and concrete 23. Vinyl ester resin DERAKENE MFE 711 (produced by ASHLAND) was used in this study. Methyl Ethyl Ketone Peroxide (MEKP) produced by PT. Kawaguchi Kimia Indonesia was used as a catalyst and curing agent. The 6% cobalt naphthenate (produced by PT. Justus Sakti Raya) was used as a accelerant. Chopped-strand mat E-glass type fiber was used as the reinforcing fiber.
Epoxy resin is also used in this study as a comparison. Epoxy is increasingly utilized due to its high specific stiffness and strength, corrosion resistance, and chemical compatibility with reinforcing fibers 24, 25. Bisphenol A-diglycidyl ether (DGEBA, R140) epoxy resin was used in this study. Poly(oxypropylene) diamine JEFFAMINE D230 was used in this study as curing agent.
Specimen Preparations
Vinyl ester GFRP specimens were prepared by mixing the resin with curing agent and catalyst at a mass ratio of 100:1:0.5, respectively. After mixing and degassing process, the mixture was poured into the glass fiber on the top steel mold and cured at room temperature for 24 hours. The cured glass fiber-VE plates were then removed from the mold. The specimen was precisely cut into small pieces at a dimension of 60 × 25 × 2 mm (length × width × thickness), as shown in Figure 1. To remove mold release and other material that could interfere with surface adsorption, all specimens were cleaned with water, then dried at room temperature for 1-2 days.
Figure 1.Final specimens of glass-fiber VE composites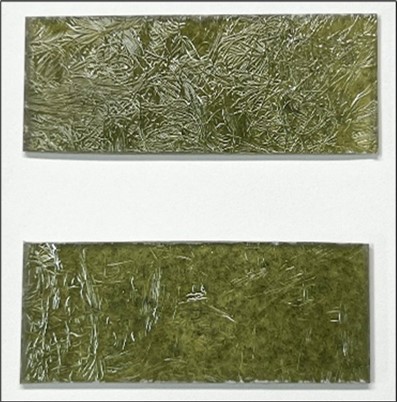
Specimen of epoxy was prepared by mixing with the curing agent at a mass ratio of 100:30.6. After mixing and degassing process, it was poured into the glass fiber on pre-heated steel mold and cured using a hot press at a schedule of 60˚C for 6 hours for the first curing and 110 ˚C for 12 hours for the second curing. After finishing the curing procedure in a hot press, cooling to room temperature, and the cured epoxy plates were removed from the mold.
Vinyl ester GFRP and epoxy GFRP specimens were prepared for both control and cyclic concentration exposure tests. The control specimens were fabricated using the same mixed design and manufacturing process as the test specimens but were not subjected to any cyclic exposure. Instead, the baseline material behavior under neutral conditions for comparison.
Cyclic Concentration Exposure Test
The specimens were prepared for both vapor phase and liquid phase. Specimens were exposed to varying HCl concentrations at specified time intervals. Specimens are changed from higher HCl concentration to lower concentration or water alternately. In this study, for vinyl ester specimens, six pairs of HCl concentrations were tested to see how they break down when switched between different levels: 35 mass% HCl and water, 20 mass% HCl and water, 10 mass% HCl and water. Epoxy specimens are only exposed to 35 mass% HCl and 0 mass% HCl (water). The temperature was constantly kept at 40˚C. For HCl exposure, experiment was done inside an acid chamber. Meanwhile, for water exposure, the specimens in glass beakers filled with water were placed in a 40˚C water bath.
The specimen undergoes a full exposure cycle of 720 hours (30 days). A 5-day exposure in a solution is classified as half-cycles; thus, specimens initially exposed to HCl and subsequently to water represent one complete cycle, as illustrated in Figure 2. Schemes 2 and 3 were implemented to examine the variation in degradation resulting from exposure to varying concentrations of HCl cycles. The experiment included HCl concentrations of 35 mass%, 20 mass%, and 10 mass%, as illustrated in Figure 3 and Figure 4.
Figure 2.Scheme-1: HCl 35 mass% - water cyclic concentration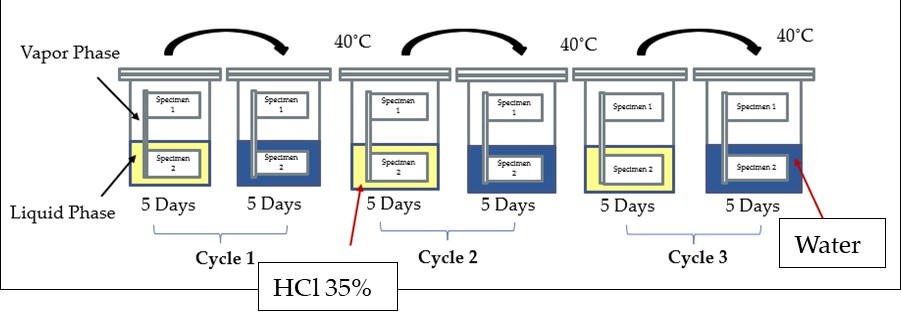
Figure 3.Scheme-2: HCl 20 mass% - water cyclic concentration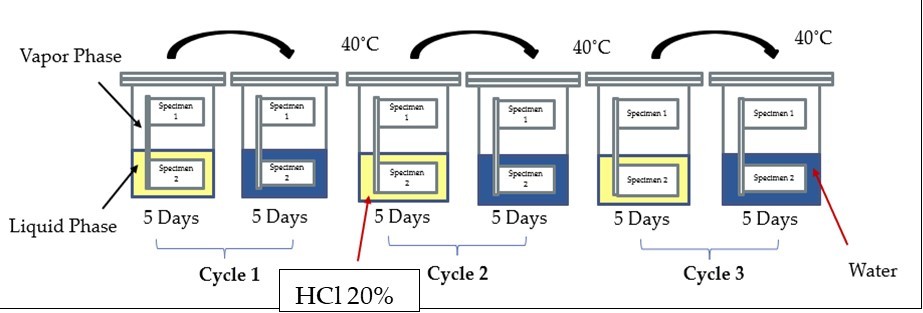
Figure 4.Scheme-3: HCl 10 mass% - water cyclic concentration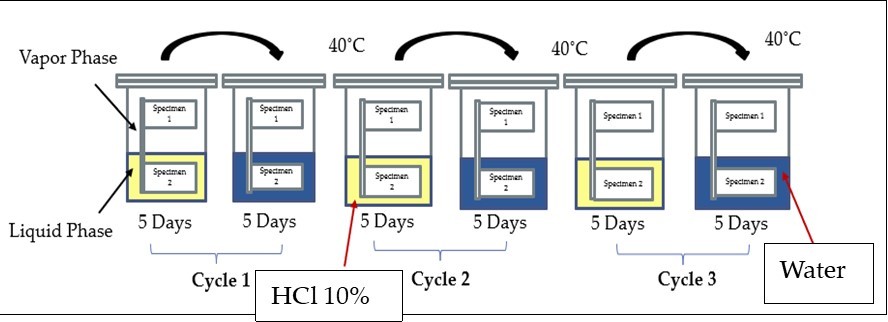
Analysis Methods
Gravimetric Analysis
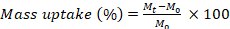
Gravimetric analysis was used to estimate the amount of penetrated acid solutions by measuring mass change and dimensional change. Each specimen was removed from the solution and patted dried by towel/tissue, and then the mass was measured on a digital balance with an accuracy of 0.0001 g. The change in mass of the specimens was calculated based on Eq. 1, where Mt is mass of specimen at time t and M0 is initial mass of specimen.
 (1)
(1)
Dimensional measurements were done using digital caliper with an accuracy of 1μm. The changes in thickness, length, and width were calculated based on Eq. (2-4).
Where h is thickness of specimen at time t, h0 is initial thickness of specimen, lt is length of specimen at time t, l0 is initial length of specimen, wtis width of specimen at time t, and w0 is initial width of specimen.
Mechanical Testing
A three-point bending test was conducted using the Shimadzu Autograph AGS-1KNJ machine to assess the impact of acid penetration on the mechanical properties of the specimens, specifically to determine the flexural strength of the material following exposure to the solution. The test was performed at a crosshead speed of 2 mm/min, following ASTM D790 standards 26.
Scanning Electron Microscopy (SEM)/ Energy Dispersive X-ray Spectroscopy (EDS) Observation
Following the bending test, the cross-section of the specimen exposed to the vapor phase and liquid phase was observed using JEOL JSM-6510LA SEM/EDS machine. SEM was used to examine the morphology of fracture surfaces. Meanwhile, EDS was used to determine the chemical composition of materials and to create element composition maps, which was used to determine the penetration depth of Cl in the specimen.
Fourier-Transform Infrared (FTIR) Analysis
FTIR observation is conducted to determine chemical reactions that occurred on cured VE while exposed to cyclic concentrations. FTIR spectra were obtained using an FTIR-ATR (Shimadzu AIM-8000R) at a resolution of 4 cm-1 and a minimum of 60 scans averaged per spectrum. To get a representation of the pattern of the whole surface area, spectra from at least three points on a specimen were averaged.
Size Exclusion Chromatography (SEC) Analysis
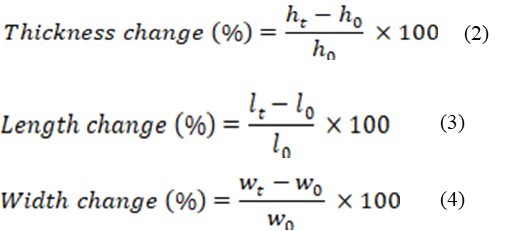
SEC is a technique that separates molecules based on their sizes, allowing for the determination of the molecular weight distribution of the organic soluble components of a polymer 27, 28. Through SEC analysis, it can be determined whether the resin is leaching out in the HCl solution. The sample preparation for SEC analysis is as shown in Figure 5. After exposing GFRP to HCl solution for 30 days, the post-exposure HCl solution was collected for analysis. The HCl solution was subjected to liquid–liquid extraction using ethyl acetate. Following extraction, the mixture is separated into an organic phase (resin dissolved in ethyl acetate) and an aqueous phase (HCl and ethyl acetate). To neutralize any residual acidity, the organic phase was treated with a saturated aqueous solution of sodium bicarbonate (NaHCO3), and the resulting aqueous layer was removed. The purified organic phase was then concentrated by evaporation under reduced pressure to remove ethyl acetate, yielding an organic solid. This solid was subsequently dissolved in tetrahydrofuran (THF) at a concentration of 100 mg per 10 ml. Finally, a 0.4 ml (400 µl) aliquot of the THF solution was injected into a SEC column for molecular weight distribution analysis.
Figure 5.Schematic process diagram of extraction and SEC sample preparation from post-exposure HCl Solution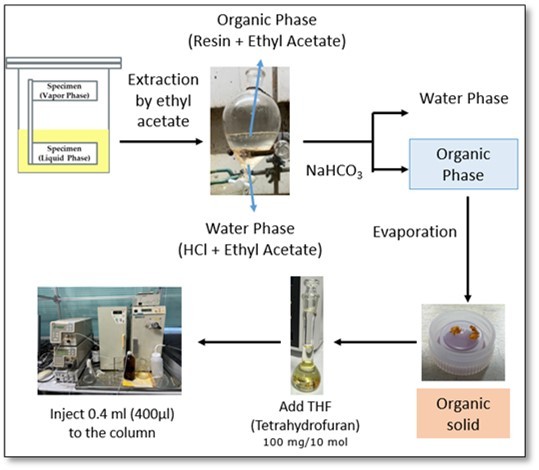
Results and Discussion
Mass Uptake during Exposure to Cyclic Concentration
The mass uptake was analyzed using gravimetric analysis following exposure of the specimens to cyclic concentration. The result of mass uptake measurement after being exposed to cyclic concentration of 35 mass% HCl and water for 720 hours are shown in Figure 6. In Cycle 0.5 (0-120 h) penetration occurred on the surface of the GFRP composite when first exposed to 35 mass% HCl. Between 120 and 240 hours, the specimens are exposed to water, during which water absorption primarily occurs due to osmotic pressure. This pressure drives water from the surrounding environment into the polymer matrix, leading to an increase in mass uptake observed during cycle 1 (120–240 h). Under liquid-phase conditions, HCl is initially concentrated at the surface of the polymer after initially exposed to a 35 mass% HCl. Additionally, a relatively large volume of water is present, leading to a high concentration difference of HCl between the polymer surface and surrounding solution. This promotes the leaching of HCl from the polymer into the surrounding solution. In contrast, under vapor-phase conditions, the amount of water available is significantly lower. Water condenses on the polymer surface, forming only a thin layer. This limited water availability slows the diffusion of HCl out from the polymer. Moreover, the thin condensed water layer may become saturated with HCl, further hindering its release into the vapor phase. As a result of these mechanisms, the polymer in the vapor-phase condition exhibits a greater mass uptake than in the liquid-phase condition, despite the lower water content.
Figure 6.Mass uptake of specimens exposed to 35 mass% HCl-water cyclic concentration at 40°C
During Cycle 1.5 (240–360 h), both the liquid and vapor phase specimens are re-exposed to the HCl solution, allowing them to encounter the acid once again. By this point, a significant amount of water has already been absorbed into the polymer. When the specimens are placed back into a high-concentration HCl environment, the external solution draws water out of the polymer due to osmotic effects 29, 30, 31, 32. As a result, the mass of specimens decreases during this cycle. When exposed to vapor, a significant amount of water is trapped inside the polymer. This trapped water may help the polymer return to its previous level of mass uptake. However, since the duration of Cycle 1.5 (240–360 h) is relatively short, the mass uptake in the vapor phase remains slightly higher than in the liquid phase during this period. This suggests that the same mechanisms observed earlier such as limited leaching and high internal water content may continue to drive mass uptake in the vapor phase. Cycle 2 and 3 follow the same mechanism observed in Cycle 1, where the specimens absorb water during exposure, primarily driven by osmotic pressure. Similarly, Cycle 2.5 (480–600 h) exhibits the same behavior as Cycle 1.5 (240–360 h), during which the specimens are re-exposed to the HCl solution, resulting in water being drawn out of the polymer and leading to a decrease in mass uptake.
Figure 7 (a) and Figure 7 (b) present a comparison of mass uptake for specimens exposed to cyclic concentrations of 35 mass% HCl-water, 20 mass% HCl-water, and 10 mass% HCl-water. The specimen exposed to 35 mass% HCl-water shows a significantly higher mass uptake compared to those exposed to 10 mass% HCl-water and 20 mass% HCl-water. One possible reason for this difference is that 10 mass% HCl-water and 20 mass% HCl-water are far from the maximum achievable HCl concentration under normal atmospheric pressure. This lower concentration may result in weaker osmotic driving forces and less aggressive diffusion behavior, which could influence the overall absorption mechanism.
Figure 7 (a).Mass uptake of specimens exposed to 35 mass% HCl-water, 20 mass% HCl-water, 10 mass% HCl-water cyclic concentration at 40°C in vapor phase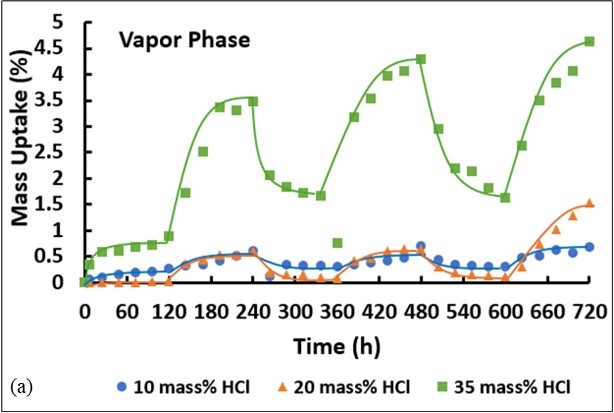
Figure 7 (b).Mass uptake of specimens exposed to 35 mass% HCl-water, 20 mass% HCl-water, 10 mass% HCl-water cyclic concentration at 40°C in liquid phase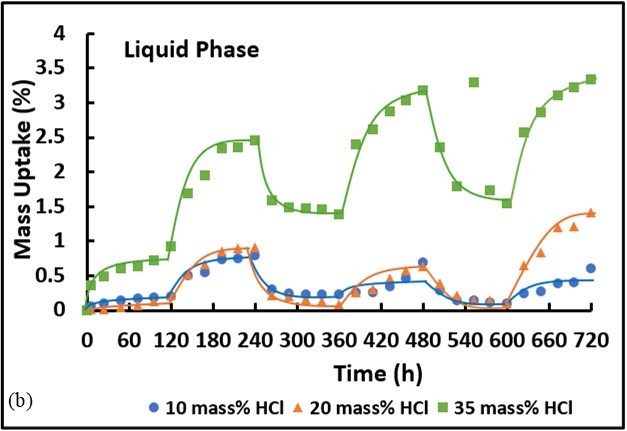
Thickness Change during Exposure to Cyclic Concentration
In addition to determining the mass uptake, dimensional change was also assessed. Figure 8 illustrates the changes in thickness, length, and width for both the vapor phase and liquid phase. The results indicate that the increase in thickness is significantly larger than the changes in length and width. This finding suggests that there is minimal change in the size of the specimen, but there may be surface penetration. In GFRP specimens, dimensional changes during environmental exposure are often anisotropic (vary depending on the direction) due to the material’s internal structure 33, 34. GFRP is a composite made of stiff, aligned glass fibers embedded in a polymer matrix. The glass fibers in the specimen used for this research are oriented in the plane of the specimen, primarily along the length and width directions, which provides high stiffness and dimensional stability in those directions 35, 36 As a result, any swelling or dimensional change due to mass uptake is largely constrained along the length and width because the fibers restrict expansion. In contrast, the thickness direction contains fewer or no reinforcing fibers, making it less constrained. Therefore, when water is absorbed into the polymer matrix, the matrix can swell more freely in the thickness direction, leading to measurable dimensional change in thickness, while the length and width remain relatively unchanged.
Figure 8 shows that the thickness change in vapor phase is bigger than liquid phase. This result suggests that similar mechanisms are at play in both conditions, and the changes are proportional to the mass uptake observed. The phenomenon of osmotic pressure induces the swelling of materials and subsequently contributes to their degradation.
Figure 8.Dimensional change of specimens exposed to 35 mass% HCl-water cyclic concentration at 40°C in (a) vapor phase, and (b) liquid phase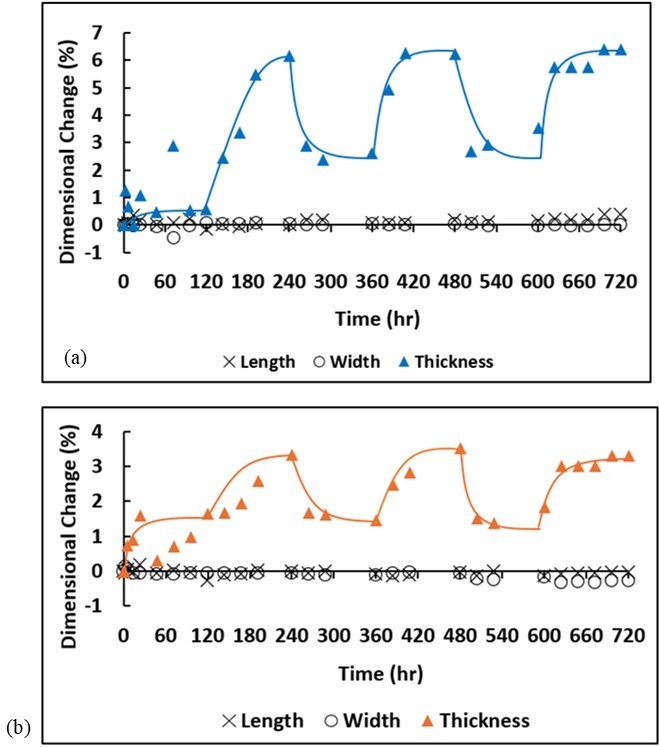
Mechanical Properties
The mechanical properties of the vapor phase and liquid phase specimens were analyzed using a three-point bending test. The flexural strength of the specimens exposed to cyclic concentration conditions can be seen in Figure 9. Acid penetration results in decreased mechanical properties. As shown in Sections 3.1 and 3.2, HCl and water penetrate the network and cause significant swelling, leading to plasticization. Moreover, this plasticization/swelling effect was the primary reason for the decrease in flexural strength 37, 38. If swelling occurs, very short molecular weight chemicals inserted in the matrix which resulted in reduced polymer-polymer interaction and increased plasticization 39 Swelling does not result in direct interaction, but 3D construction will be extended, which resulted in plasticization.
Figure 9.Flexural strength of specimens exposed to various HCl cyclic concentration in (a) vapor phase and (b) liquid phase at 40°C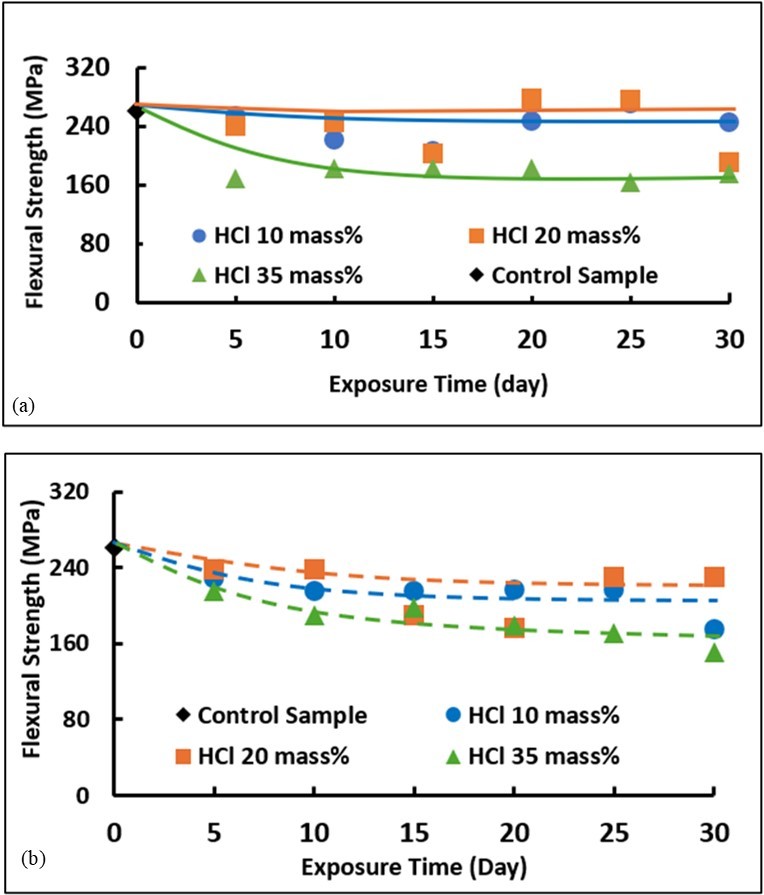
The flexural strength of the vapor phase and liquid phase specimens show different trends. When comparing the flexural strength in the vapor phase, there is a similarity in the results between exposure to 10 mass% HCl-water and 20 mass% HCl-water. However, there is a significant difference in flexural strength after exposure to 35 mass% HCl-water. Meanwhile, in the liquid phase, the flexural strength values for all exposure conditions showed similar results.
EDS Observation
Following the bending test, the specimen cross-section surface in the vapor phase and liquid phase was observed and analyzed. The penetration depth of Cl from mapping of cross-section surface is investigated for each vapor phase and liquid phase exposure at initial condition and after 5 days, 10 days, 15 days, and 20 days of 35 mass% HCl-water cyclic exposure.
The progression of Cl penetration with immersion time was confirmed. Figure 10 shows that Cl penetration in VE occurs at a very slow rate compared to epoxy (EP) 40, 41, 42, 43. There is no significant difference in the depth of Cl penetration between exposure to the vapor and liquid phases. This small difference is attributed to the mechanisms of Cl infiltration. In the vapor phase, Cl enters the material either as a gas or as condensed Cl, leading to a lower overall concentration compared to the direct dissolution and transport in the liquid phase. Additionally, the Cl distribution appears concentrated near the surface, deviating from the expected behavior based on simple Fick’s law diffusion 44, 45. This deviation is likely due to the effects of cyclic concentration processes near the surface. While the distribution pattern of Cl does not vary significantly between phases, the key distinction lies in water uptake behavior. The amount of water absorbed differs greatly between the vapor and liquid environments, which is the primary reason for the observed discrepancy in Cl accumulation.
Figure 10.Cl penetration from EDS mapping for specimens exposed for 5, 10, 15, and 20 days of 35 mass% HCl-water cyclic concentration in vapor phase and liquid phase
FTIR Analysis
As depicted in Figure 11, the progression of hydrolysis was confirmed at a preliminary level through infrared spectroscopy, wherein a decrease in the ester band (more specifically a combination of C–O stretch and O–H bend) is observed 46. The peaks at 1605 cm−1, 1509 cm−1, and 1452 cm−1 (benzene ring) and at 1240 cm−1 and 1041 cm−1 (ether bond) were still present in the products, showing that the carbon framework remained intact during the degradation process. From FTIR results, it can be concluded that hydrolysis has occurred on the material under HCl cyclic concentration exposure.
Figure 11.FTIR spectra for (a) vapor phase and (b) liquid phase after 30 days exposure in 35 mass% HCl-water cyclic concentration at 40ºC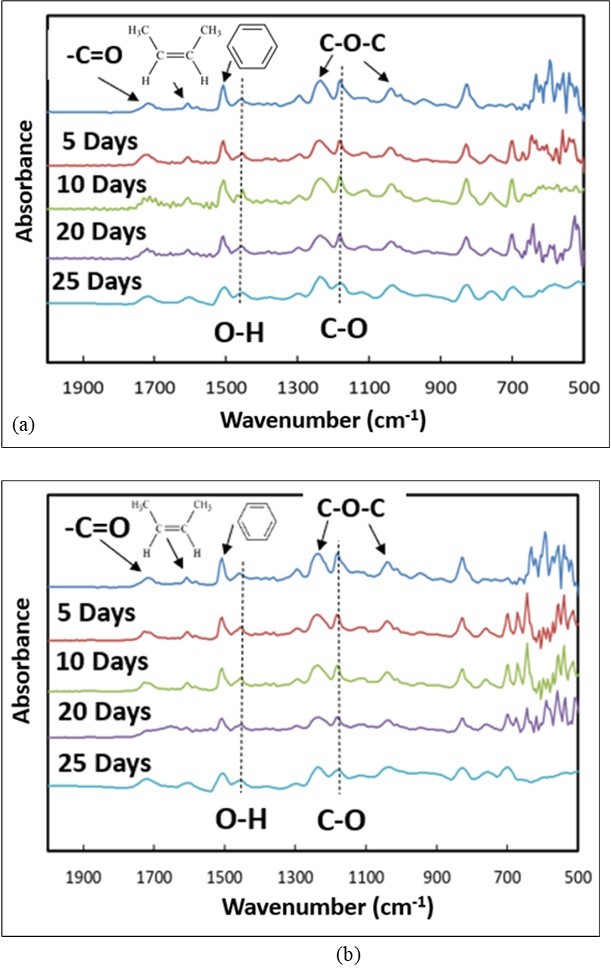
SEC Analysis
Components eluted into the hydrochloric acid solution were analyzed to determine whether any resin had leached from the specimen into the solution. The peak observed at a shorter retention time corresponds to high-molecular-weight VE species. In size exclusion chromatography (SEC), larger molecules elute earlier because they are unable to penetrate the porous structure of the column’s packing material. Consequently, these macromolecules are excluded and travel more rapidly through the column, whereas lower molecular weight species enter the pores and elute later 47, 48, 49, 50, 51.
As shown in Figure 12, the first peak at approximately 18 minutes corresponds to low-molecular-weight components such as styrene, methacrylic acid, and catalyst residues. SEC analysis of pure styrene confirmed a single peak at this retention time, supporting this assignment. The second peak, observed at around 35 minutes, is likely associated with the THF solvent itself. Based on these results, estimating the molecular weight of the residual VE resin under cyclic acid exposure is difficult. However, the presence of low-molecular-weight degradation products indicates chain scission at the ends of the vinyl ester backbone, suggesting resin leaching and mass loss from the composite.
Figure 12.SEC result of chemical species dissolved in HCl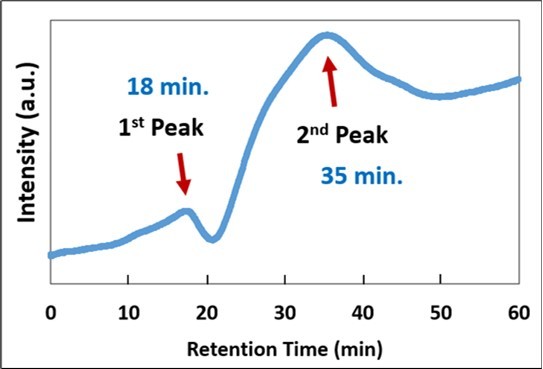
Comparison of Degradation Behavior between GFRP VE vs GFRP Amine cured Epoxy (EP)
The degradation behavior of different resin material in GFRP can be investigated by comparing the evaluation results. In previous research, degradation behavior of GFRP with amine-cured EP was also investigated using gravimetric analysis 52. Figure 13 shows how much mass EP and VE resins gain when exposed to HCl and water in both vapor and liquid phase over time. In the case of EP resin, it shows a much bigger mass change than VE resin, particularly in the vapor phase.
Figure 13.Mass uptake of GFRP EP vs GFRP VE composites exposed in 35 mass% HCl-water cyclic concentration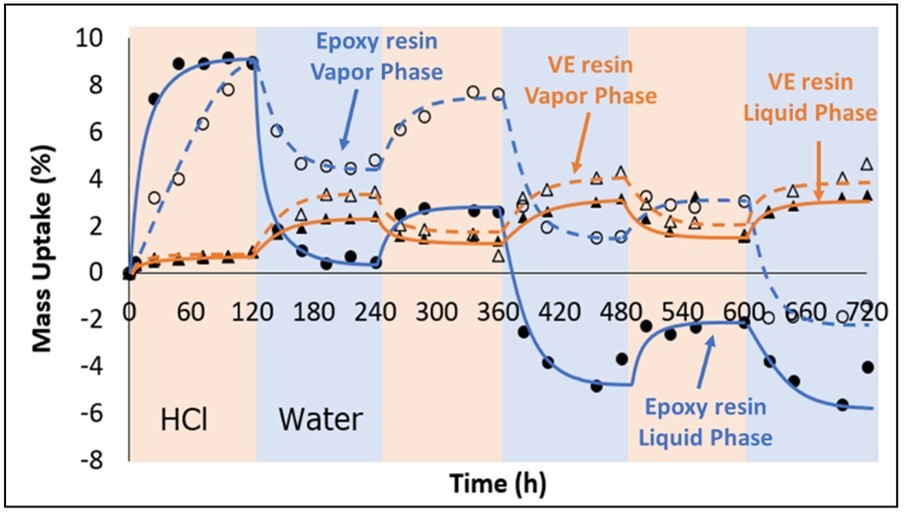
In contrast, VE resin shows a relatively stable and gradual increase in mass uptake, especially after transitioning to the water phase. This suggests greater penetration of water or HCl into the resin, but with minimal leaching, as evidenced by the consistent upward trend in mass over time. After switching from HCl to water (around 360 hours), EP resin in both vapor and especially liquid phases shows a clearderease, indicating degradation and material loss. The saturation behavior and negative mass uptake values further support this indicating extensive leaching in the water phase. In the case of VE resin, the mass uptake remains positive throughout the experiment, suggesting less structural degradation. Overall, EP resin is more susceptible to degradation and leaching, while VE resin shows better retention and controlled absorption, indicating higher durability under alternating chemical exposures.
Figure 14 shows the thickness change of different GFRP (EP and VE) over time under HCl-water cyclic concentration in both vapor and liquid phases. In the case of EP, exposure in liquid phase (0-240 hours) leads to a significant increase in thickness, going up by more than 20%. In contrast, the vapor phase (240-480 hours) shows a smaller increase in thickness of 10-15%, meaning there is less swelling or absorption in vapor conditions.
Figure 14.Thickness change of GFRP EP vs GFRP VE exposed in 35 mass% HCl-water cyclic concentration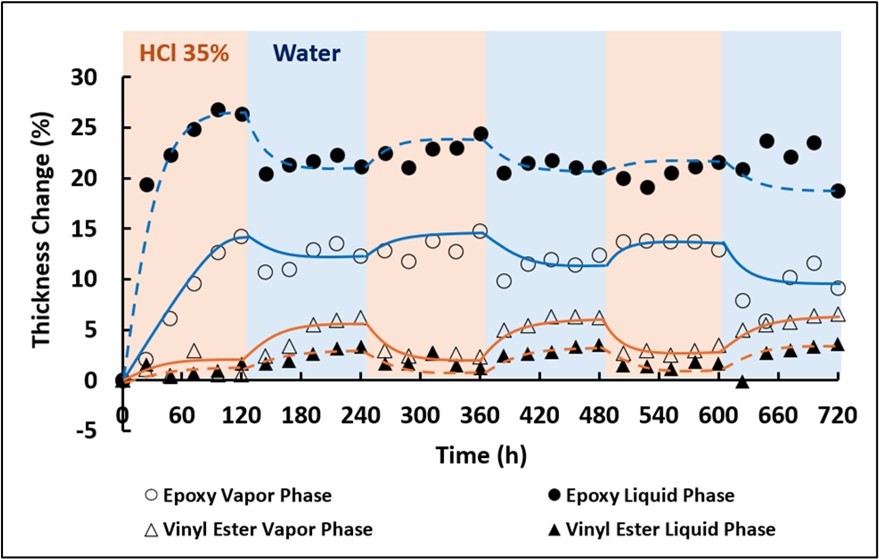
Meanwhile, in the VE case, exposure in vapor phase for 240 to 480 hours leads to a small thickness increase of about 5%, showing it is more resistant than the epoxy resin. In the liquid phase (480-720 hours), the VE shows a minimal thickness change, generally less than 5%, suggesting a stronger resistance to liquid absorption compared to epoxy resin.
Conclusions
This research studied the degradation behavior of GFRP VE specimens under HCl cyclic concentration to acknowledge the cause of the roof tank failure which affected by the factor of cyclic concentration on vapor phase and liquid phase. Based on the experimental results, the following conclusions can be drawn:
1. The effect of dynamic cyclic concentration change was confirmed.
2. From mass uptake results, penetration occurred on the surface of VE GFRP specimens when first exposed 35 mass% in half-cycles. When specimen is placed in water after HCl exposure, a new concentration gradient is established. Concentration of HCl inside the GFRP is higher than that of the external water. This difference in concentration creates osmotic pressure that results in the movement of water from low HCl concentration region to high HCl concentration region, leading to an increase in mass of the specimen. In cycle 1.5 (240-360 h), a large amount of water that has penetrated is released due to the osmotic pressure of the concentrated hydrochloric acid outside, resulting in a decrease in mass. Some of the water may have moved to a deeper part of the sample that has not yet contained water. At the same time, the solutes from the concentrated hydrochloric acid will enter the sample. This conclusion strengthened by acid content profile in cross-sectional chemical mapping from EDS result.
3. Thickness change results confirmed that swelling has occurred in the VE GFRP specimens. The thickness change in the vapor phase is around 6%, which is greater than the liquid phase's change of 3%. The thickness changes seen in the vapor and liquid phases show that the same processes are happening in both cases, and these changes relate to the amount of mass absorbed.
4. Material swelling leads to plasticization, and this effect was the primary reason for the decreases in flexural strength. The phenomena of swelling and plasticization subsequently contribute to material degradation.
5. EDS results show an acid content profile from specimen’s cross-sectional mapping for each cycle. The difference in HCl distribution in the specimen can be seen between the vapor phase and the liquid phase when exposed to 35 mass% HCl and water. Concentration of the Cl distribution is observed near the surface, which deviates from the simple Fick’s law diffusion prediction. The observed variance is most likely caused by cyclic concentration processes that occur near the surface. The distribution pattern of Cl remains generally similar over phases, however the behavior of water uptake differs most significantly. The volume of water absorbed varies significantly between vapor and liquid environments, which is the main factor contributing to the highlighted difference in Cl accumulation.
6. FTIR result indicates that a chemical reaction occurred following cyclic exposure. Hydrolysis is preliminarily confirmed by a reduction in the ester band.
7. The results from mass uptake in cycle 1.5 (240-360 h) and cycle 2.5 (480-600 h) indicate a decrease in mass, attributed to the leaching of material components. Consequently, SEC was performed to observe whether the resin is leaching out in the HCl solution. The results of first peak and second peak indicate the presence of low-molecular-weight degradation products, which suggests chain scission at the ends of the vinyl ester backbone. This observation implies resin leaching and mass loss from the composite.
8. Epoxy-amine cured matrix fiber reinforced plastics were also studied in comparison to Vinyl Ester Matrix Fiber Reinforced Plastics to determine degradation behavior differences. The mass change in epoxy is significantly more than that of vinyl ester at half-cycle exposure, with epoxy exhibiting an 8% change compared to 1% for vinyl ester, resulting in a difference nearly eightfold. Bisphenol-A type of epoxy comprises hydroxyl groups that can attract and retain water. EP results indicate higher diffusion of acid and water. The presence of acid results in an increase in mass uptake and swelling. Also, the negative mass uptake value in the GFRP EP case showed that chemical reactions, such as breaking of chains, will happen, causing some polymer parts to wash away and the overall mass to decrease. This indicates that EP resin shows an increased vulnerability to degradation and leaching. Meanwhile, VE resin has better chemical resistance; VE does not react with acid, but acid will penetrate slowly to the material. VE leads to less water/acid uptake and smaller thickness changes.
Acknowledgements
This research was funded by the Ministry of Education, Culture, Sports, Science and Technology (MEXT) of Japan under the MEXT Scholarship Program. The author gratefully acknowledges this financial support.
References
- 1.Kusano Masahiro, Kanai Takafumi, Arao Yoshihiko, Kubouchi Masatoshi. (2017) Degradation behavior and lifetime estimation of fiber reinforced plastics tanks for hydrochloric acid storage. DOI: 10.1016/j.engfailanal.2017.06.004. Engineering Failure Analysis. 79, 971-979.
- 2.Tamer Ali Sebeay, Ahmed Azzam. (2023) . Numerical Investigation into GFRP Composite Pipes under Hydrostatic Internal Pressure. DOI: 10.3390/polym15051110. Polymers 15(5), 1110.
- 3.International ASTM. (2010) ASTM D4097-01:Standard Specification for Contact-molded Glass-fiber-reinforced Thermoset Resin Corrosion-resistant Tanks. 10-1520.
- 4.Japanese Standards Association. (2013) JIS K 7012: Glass fiber reinforced thermosetting resin chemical-resistant tanks. Tokyo: Japanese Standards Association.
- 5.R C Allen. (1979) Some corrosion mechanisms in attack of resin and resin-glass laminates. DOI: 10.1002/pen.760190502. Polym Eng Sci 19, 329-336.
- 6.Fraga A N, Alvarez V A, Vazquez A, O de la. (2003) Relationship between dynamic mechanical properties and water absorption of unsaturated polyester and vinyl ester glass fiber composites. DOI: 10.1177/0021998303029421 . , Journal of Composite Materials 37(17), 1553-1574.
- 7.Paczkowski P, Puszka A, Gawdzik B. (2022) . Investigation of Degradation of Composites Based on Unsaturated Polyester Resin and Vinyl Ester Resin. DOI: 10.3390/ma15041286 Materials 15, 1286.
- 8.Hota Gangarao, Barker William, Manalo Allan. (2020) Degradation mechanism of glass fiber/vinyl ester-based composite materials under accelerated and natural aging.DOI: 10.1016/j.conbuildmat.2020.119462. Cons. and Build. , Mat 256, 119462.
- 9.Chin J, Hughes W, Signor A. (2001) Elevated Temperature Aging of Glass Fiber Reinforced Vinyl Ester and Isophthalic Polyester Composites in Water, Salt Water, and Concrete Pore Solution, American Society for Composites. [online]https://tsapps.nist.gov/publication/get_pdf.cfm?pub_id=860375. 16th Technical Conference .
- 10.Shahram Eslami, Abbas Honarbakhsh-Raouf, Eslami Shiva. (2014) Effects of moisture absorption on degradation of E-glass fiber reinforced Vinyl Ester composite pipes and modelling of transient moisture diffusion using finite element analysis. DOI: 10.1016/j.corsci.2014.10.009. Corrosion Science 90, 168-175.
- 11.Chu W, V M Karbhari. (2005) Effect of water sorption on performance of pultruded e-glass/vinyl ester composites. DOI: 10.1061/(ASCE)0899-1561(2005)17: 1(63). , Journal of Materials in Civil Engineering 17(1), 63-71.
- 12.V M Karbhari. (2005) Dynamic mechanical analysis of the effect of water on e-glass-vinyl ester composites. DOI: 10.1177/0731684406058274. , Journal of Reinforced Plastics and Composites 25(6), 631-644.
- 13.V M Karbhari, Wang Q. (2004) Multi-frequency dynamic mechanical thermal analysis of moisture uptake. in E-glass/vinyl ester composites. DOI: 10.1016/j.compositesb.2004.01.003 Composites Part B: Engineering 35(4), 299-304.
- 14.Yin X, Liu Y, Miao Y, Xian G. (2019) Water absorption, hydrothermal expansion, and thermomechanical properties of a vinyl ester resin for fiber-reinforced polymer composites subjected to water or alkaline solution immersion.DOI: 10.3390/polym11030505. , Polymers 11, 505.
- 15.Alvarez V, Vazquez A, O De La. (2007) Cyclic water absorption behavior of glass—vinyl ester and glass—epoxy composites. doi: 10.1177/0021998306067311. , Journal of Composite Materials 41(10), 1275-1289.
- 16.Alia Cristina, José A, Juan C, José M, José M. (2018) Characterization of the chemical structure of vinyl ester resin in a climate chamber under different conditions of degradation.DOI: 10.1016/j.polymdegradstab.2018.04.014. Polymer Degradation and Stability. 153, 88-99.
- 17.Thomason J, Xypolias G. (2023) Hydrothermal ageing of glass fibre reinforced vinyl ester composites: a review. , DOI: https://doi.org/10.3390/polym15040835 Polymers 15, 835.
- 18.He W, Li X, Li P, Fang S, Ding A. (2022) Experimental investigation on hygroscopic aging of glass fiber reinforced vinyl ester resin composites. , DOI: https://doi.org/10.3390/polym14183828. Polymers 14, 3828.
- 19.Brahim Benmokrane, Dr-Ahmed Ali, Hamdy Mohamed, Adel ElSafty, Allan Manalo. (2017) Laboratory assessment and durability performance of vinyl-ester, polyester, and epoxy glass-FRP bars for concrete structures. DOI: https://doi.org/10.1016/j.compositesb.2017.02.002. Composites Part B: Engineering 114, 163-174.
- 20.Pradyawong Pradchar, Sakai Tetsuya, Aoki Saiko, Kubouchi Masatoshi. (2013) The effect of cyclic water temperature on flexural property of unsaturated polyester resin under liquid and vapor phase. Proc. the 19th International Conference on Composite Materials , Montreal, Canada 1644-1652.
- 21.Pradyawong Pradchar, Kubouchi Masatoshi, Aoki Saiko, Sakai Tetsuya. (2014) The effect of cyclic temperature corrosive process fluid on flexural property of matrix resin. Proc. NACE corrosion , San Antonio, Texas, USA 1-13.
- 22.James I Chang, Lin Cheng-Chung. (2006) A study of storage tank accidents.DOI:. 10.1016/j.jlp.2005.05.015. Journal of Loss Prevention in the Process Industries.19(1) 51-59.
- 23.Sarasini F, Santulli C. (2013) 4 - Vinylester resins as a matrix material in advanced fibre-reinforced polymer (FRP) composites. DOI: 10.1533/9780857098641.1.69. Advanced Fibre-Reinforced Polymer (FRP) Composites for Structural Applications. 69-87.
- 24.G M Odegard, Bandyopadhyay A. (2011) Physical aging of epoxy polymers and their composites. , DOI: 10.1002/polb.22384. J. Polym. Sci. B Polym. Phys 49(24), 1695-1716.
- 25.B C Ray, Rathore D. (2015) Environmental damage and degradation of FRP composites: a review report. , DOI: 10.1002/pc.22967. Polym. Compos 36(3).
- 26.International ASTM. (2017) ASTM D790-17: Standard Test Methods for Flexural Properties of Unreinforced and Reinforced Plastics and Electrical Insulating Materials. 10-1520.
- 27.Orlova Yuliia, Rebecca E Harmon, Linda J Broadbelt, Piet D Iedema. (2021) Review of the kinetics and simulations of linseed oil autoxidation. DOI: 10.1016/j.porgcoat.2020.106041. Progress in Organic Coatings 151, 106041.
- 28.Sýkora David. (2003) František Švec. Chapter 20-Synthetic Polymers.DOI: , Journal of Chromatography Library, Elsevier 67, 10-1016.
- 29.Sobrinho Ledjane, Costa Marysilvia, Bastian Fernando. (2009) The Effects of Water Absorption on an Ester Vinyl Resin System. Materials Research-ibero-american. , Journal of Materials - MATER RES-IBERO-AM J MATER 12, 10-1590.
- 30.Afshar Arash, Liao Heng-Tseng, Chiang Fu-pen, Chad S Korach. (2016) Time-dependent changes in mechanical properties of carbon fiber vinyl ester composites exposed to marine environments, Composite Structures, Volume 144. 80-85.
- 31.Grant T S, Bradley W L.In-situ observations in sem of degradation of graphite/ epoxy composite materials due to seawater immersion. , J Compos Mater 1995, 852-67.
- 32.McBagonluri F, Garcia K, Hayes M, KNE Verghese, Lesko J J.Characterization of fatigue and combined environment on durability performance of glass/vinyl ester composite for infrastructure applications. , Int J Fatigue 2000, 53-64.
- 33.Zhang Y. (2024) Study on moisture absorption characteristics of glass fibre-reinforced epoxy resin material for composite insulators based on the 3D-Fick model. DOI: 10.1049/hve2.12433. High Voltage 9(4), 888-901.
- 34.Arao Y, Koyanagi J, Hatta H, Kawada H. (2008) Analysis of time-dependent deformation of CFRP considering the anisotropy of moisture diffusion.DOI:. 10.1163/156855108X385276. Advanced Composite Materials 17(4), 359-372.
- 35.A E Krauklis, A I Gagani, A T Echtermeyer. (2019) Prediction of Orthotropic Hygroscopic Swelling of Fiber-Reinforced Composites from Isotropic Swelling of Matrix Polymer. , Journal of Composites Science 3(1), 10-10.
- 36.Tezvergil Arzu, Lassila Lippo, Vallittu Pekka. (2003) The effect of fiber orientation on the thermal expansion coefficient of fiber reinforced composites. Dental materials : official publication of the Academy of Dental Materials. 19, 471-7.
- 37.Wang M, Xu X, Ji J, Yang Y, Shen J et al.The hygrothermal aging process and mechanism of the novolac epoxy resin. , Compos. Part B Eng 2016, 10-1016.
- 38.Chen Y, J F Davalos, Ray I, Kim H-Y.Accelerated aging tests for evaluations of durability performance of FRP reinforcing bars for concrete structures. doi: 10.1016/j.compstruct.2005.08.015. [DOI] [Google Scholar] , Compos. Struct 2007.
- 39.Agarwal S, Pai Y, Pai D, G T Mahesha. (2023) Assessment of ageing effect on the mechanical and damping characteristics of thin quasi-isotropic hybrid carbon-Kevlar/epoxy intraply composites. , Cogent Engineering 10(1).
- 40.Gotou T, Katagiri N, Sakai T, Kubouchi M, Tsuda K. (2007) Detection of environmental acid penetrated in FRP using optical fiber. Proc. 16th International Conference on Composite Materials (ICCM16) , Kyoto, Japan .
- 41.Hiramoto S, Sembokuya H, Kubouchi M, Tsuda K. (2003) Degradation and penetration behavior of thermosetting resins in inorganic acid solutions. , J. Mat. Sci. Society of Japan 40(2), 79-84.
- 42.Kubouchi M, Hiramoto S, Zheng S, Sembokuya H, Tsuda K. (2005) Degradation and penetration behavior of amine cured epoxy resin in organic acid solutions. , J. Mat. Sci. Society of Japan 42(4), 35-41.
- 43.Wang T, Razaqpur A G, Chen S. (2023) Durability of GFRP and CFRP bars in the pore solution of calcium sulfo-aluminate cement concrete made with fresh or seawater. DOI: 10.3390/polym15153306. Polymers 15(15), 3306.
- 44.Takeuchi Yosuke, Ito Akira, Kasahara Hisatoshi.Yosuke Okamura, Junichirou Tamamatsu, Degradation Characteristics of Glass Fiber Reinforced Plastics Using Unsaturated Polyester as Matrix in Weak Alkaline Aqueous Solution. MATERIALS TRANSACTIONS, 2024, Volume 65, Issue 2, Pages 159-166, Released on J-STAGE January 25, 2024, Online ISSN 1347-5320, Print ISSN 1345-9678 10-2320.
- 45.Wang T, A G Razaqpur, Chen S. (2023) . Durability of GFRP and CFRP Bars in the Pore Solution of Calcium Sulfoaluminate Cement Concrete Made with Fresh or Seawater. Polymers 15(15), 3306-10.
- 46.He W, Li X, Li P, Fang S, Ding A. (2022) Experimental Investigation on Hygroscopic Aging of Glass Fiber Reinforced Vinylester Resin Composites. Polymers (Basel). 14(18), 3828-10.
- 47.Richard R Burgess. (2018) A brief practical review of size exclusion chromatography: Rules of thumb, limitations. and trouble1shooting. DOI: 10.1016/j.pep.2018.05.007. Protein Expression and Purification 150, 81-85.
- 48.Gaborieau M, Castignolles P. (2011) Size-exclusion chromatography (SEC) of branched polymers and polysaccharides. , Anal Bioanal Chem 399, 10-1007.
- 49.Gruendling Till, Guilhaus Michael, Barner-Kowollik Christopher. (2008) Quantitative LC−MS of Polymers: Determining Accurate Molecular Weight Distributions by. Combined Size Exclusion Chromatography and Electrospray Mass Spectrometry with Maximum Entropy Data Processing. DOI: 10.1021/ac800591j. Analytical chemistry 80(18), 6915-27.